Aandeel Verizon Communications | Filter Basic-Info
Aandeel: Verizon Communications (VS blue chips), ISIN: US92343V1044
| Koers | 46.60 | Hoogste koers | 51.38 |
| Laagste koers | 38.91 | 1-jrs rend. | 2.28 |
| Sector | Basismaterialen | Subsector | Telecommunicatie |
| Jaarverslag 2020 |
Contactinformatie:Staat: 140 West StPostcode: 10007Postbox: PO Box 11328Stad: New YorkLand: VSTelefoon: 800-922-0204Email: michael.stefanski@verizon.comWebsite: www.verizon.comCEO: Lowell C. McAdamCFO: Francis J. Shammo
Sectorvergelijking Verizon Communications
| Jaar | Omzet | Totaal omzet sector | Marktaandeel |
|---|---|---|---|
| 2019 | 117,634 | 696,204 | 16.90 % |
| 2020 | 105,045 | 656,163 | 16.01 % |
| 2021 | 117,534 | 702,265 | 16.74 % |
| 2022 | 127,859 | 707,752 | 18.07 % |
| 2023 | 121,398 | 717,417 | 16.92 % |
Adviezen Verizon Communications
Nieuws Verizon Communications
Verizon Communications dit jaar volgens analisten op jacht naar recordomzet
Analisten verwachten over 2021 stijgende omzet Verizon Communications, fors dividend
Verizon neemt nauwkeurig positioneringsbedrijf Senion over
Verizon Communications in Amerikaanse kopgroep qua dividendrendementen
Verizon tekent eerste private 5G-deal in Europa
Rapporten Verizon Communications
| 2016 | 2017 | 2018 | 2019 | 2020 |
|---|---|---|---|---|
Profiel Verizon Communications
|
||||||||||||||||||
| ||||||||||||||||||
|

 Verizon, |
Verizon Communications's belangrijkste details bespreken we hier. Hier beschrijven we in het kort:
Verizon Communications is als telecombedrijf actief en komt uit Amerika. KPN, , en Proximus zijn voorbeelden van andere spelers in deze sector.
Alle financiele rapporten van het concern staan hier. In New York City staat het hoofdkantoor van Verizon Communications.
Eind 2019 werkten er rond de 135 duizend bij het bedrijf.
Beleggers betaalden midden 31 maal het resultaat per aandeel.
Waarderingen en dividenden aandeel Verizon Communications
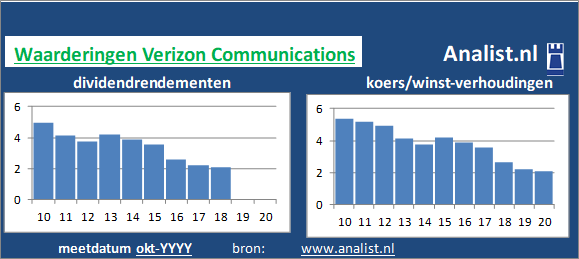
Dit jaar verliesgevend voor Verizon Communications-beleggers
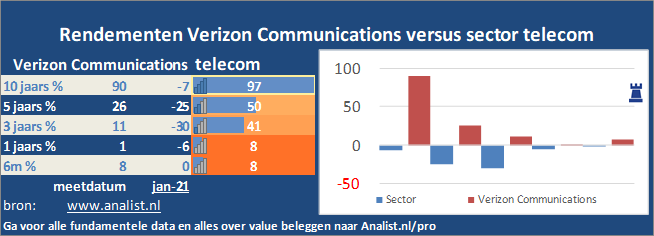
Rendementen aandeel Verizon Communications
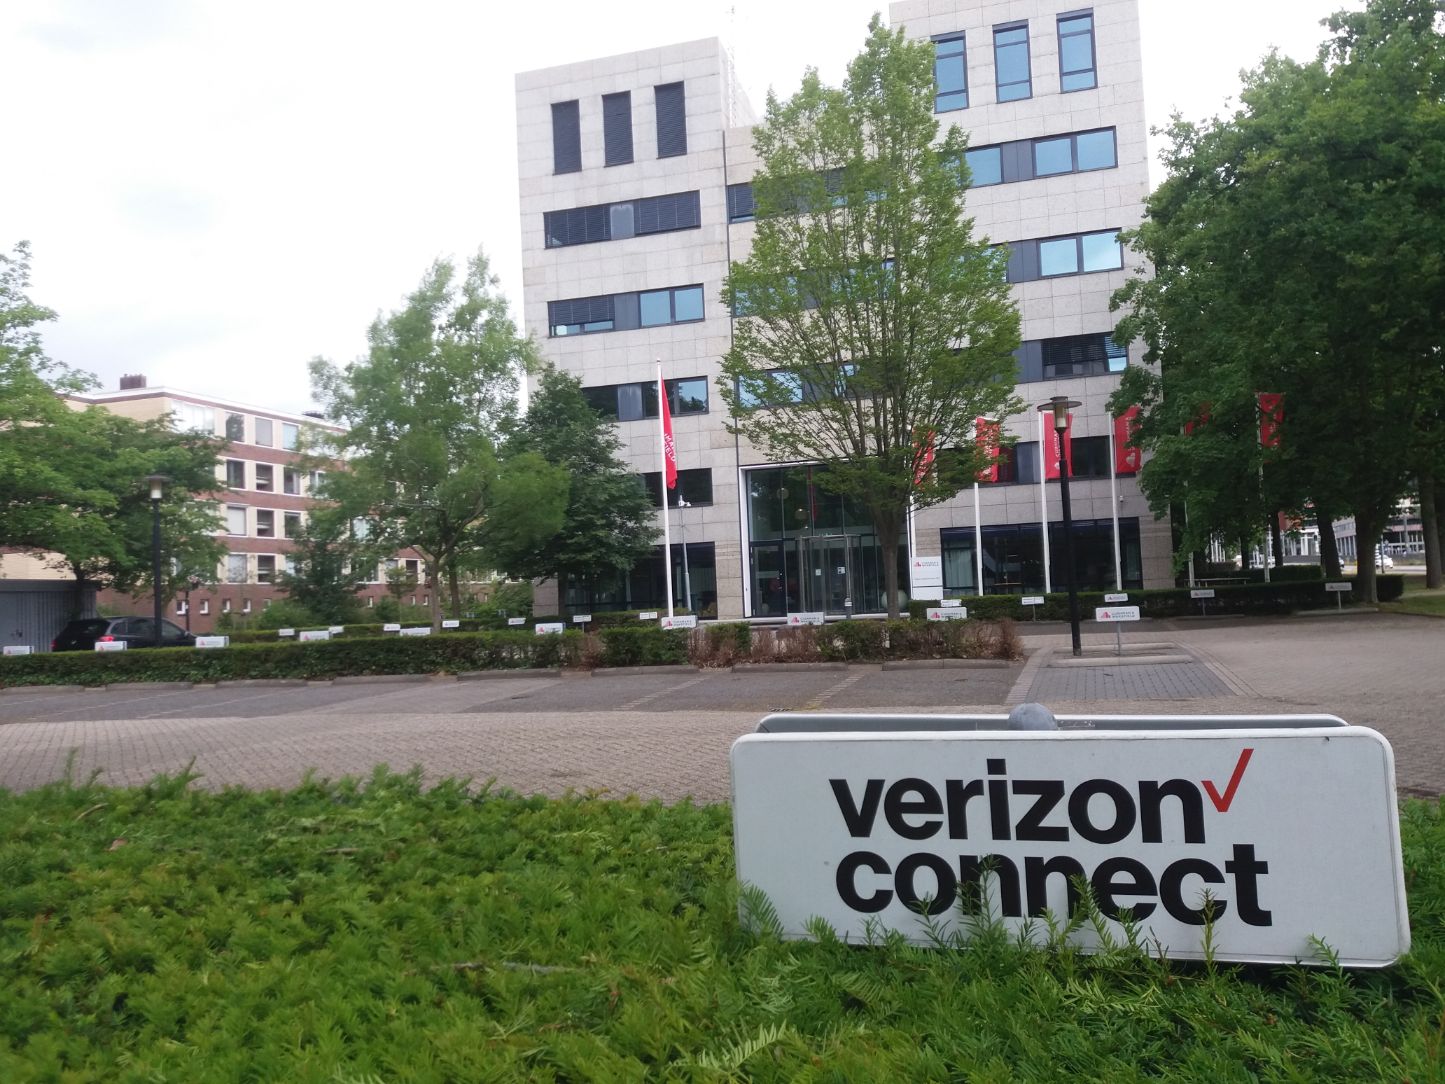 Verizon, kantoor Utrecht |
Het aandeel verloor dit jaar ruim 5 procent. Over de afgelopen 5 jaar boekte het aandeel een forse koersstijging. De vaste lijn com. sector verloor sinds 2010 ruim 29 procent. Over de voorbije 5 jaar staat de sector -35 procent lager en over de afgelopen 12 maanden 23 procent in de min.
Per de zomer van 2020 bedroeg het telecombedrijf's marktkapitalisatie rond de 346,1 miljard dollar. Op basis hiervan kunnen het aandeel een megacap aandeel noemen.

Verizon, Manhattan
Resultaten Verizon Communications
| Resultaten |
2021
|
2022
|
2023
|
2024
|
2025
|
|---|---|---|---|---|---|
| Omzet |
|
|
|
|
|
| Kosten |
|
|
|
|
|
| Nettowinst |
|
|
|
|
|
| Winstmarge |
|
|
|
|
|
| ROI |
|
|
|
|
|
Balans Verizon Communications
| Balans |
2021
|
2022
|
2023
|
2024
|
2025
|
|---|---|---|---|---|---|
| Eigen vermogen |
|
|
|
|
|
| Vreemd vermogen |
|
|
|
|
|
| Totaal vermogen |
|
|
|
|
|
| Solvabiliteit |
|
|
|
|
|
| Cash |
|
|
|
|
|
| Kasstroom |
|
|
|
|
|
| Werknemers |
|
|
|
|
|
| Omzet per werknemer |
|
|
|
|
|
| Kasstroom / vreemd vermogen |
|
|
|
|
|
Details Verizon Communications
| Details |
2016
|
2017
|
2018
|
2019
|
2020
|
|---|---|---|---|---|---|
| Koers |
53.38
|
52.93
|
56.22
|
61.40
|
58.75
|
| Winst per aandeel |
3.06
|
6.14
|
3.28
|
4.15
|
3.52
|
| Koers / winst-verhouding |
17.44
|
8.62
|
17.14
|
14.80
|
13.24
|
| Dividend |
2.16
|
1.94
|
2.07
|
2.16
|
2.02
|
| Dividend % |
4.05 %
|
3.67 %
|
3.68 %
|
3.52 %
|
4.33 %
|
| Payout % |
0.71
|
0.32
|
0.63
|
0.52
|
0.57
|
| Boekwaarde |
5.26
|
8.81
|
11.21
|
13.24
|
13.42
|
| Boek / koers |
0.10
|
0.17
|
0.20
|
0.22
|
0.29
|
| Kasstroom per aandeel |
5.06
|
4.97
|
7.25
|
7.71
|
8.26
|
| Aandelen |
4,077
|
4,079
|
4,132
|
4,136
|
4,138
|
| Marktkap. |
217.615,94
|
215.926,68
|
232.302,73
|
253.939,96
|
192.836,86
|
Dividend Verizon Communications
Koersinfo Verizon Communications
|
Datum
|
Koers
|
|---|---|
|
12 nov 2026
|
46.60
|
|
10 nov 2026
|
46.06
|
|
06 nov 2026
|
46.12
|
|
05 nov 2026
|
46.17
|
|
04 nov 2026
|
45.24
|
|
03 nov 2026
|
45.05
|
|
02 nov 2026
|
44.73
|
|
30 okt 2026
|
43.66
|
|
29 okt 2026
|
43.18
|
|
28 okt 2026
|
43.93
|
|
27 okt 2026
|
43.10
|
|
13 okt 2026
|
42.78
|
|
09 okt 2026
|
46.35
|
|
08 okt 2026
|
45.77
|
|
06 okt 2026
|
45.85
|
|
17 sep 2026
|
49.76
|
|
15 sep 2026
|
51.29
|
|
14 sep 2026
|
50.61
|
|
28 aug 2026
|
49.43
|
|
11 aug 2026
|
47.03
|
|
07 aug 2026
|
46.99
|
|
06 aug 2026
|
46.47
|
|
28 jul 2026
|
47.32
|
|
14 jul 2026
|
42.68
|
|
09 jul 2026
|
42.24
|
|
08 jul 2026
|
42.45
|
|
07 jul 2026
|
42.59
|
|
06 jul 2026
|
42.07
|
|
02 jul 2026
|
42.56
|
|
01 jul 2026
|
41.99
|